
On this page
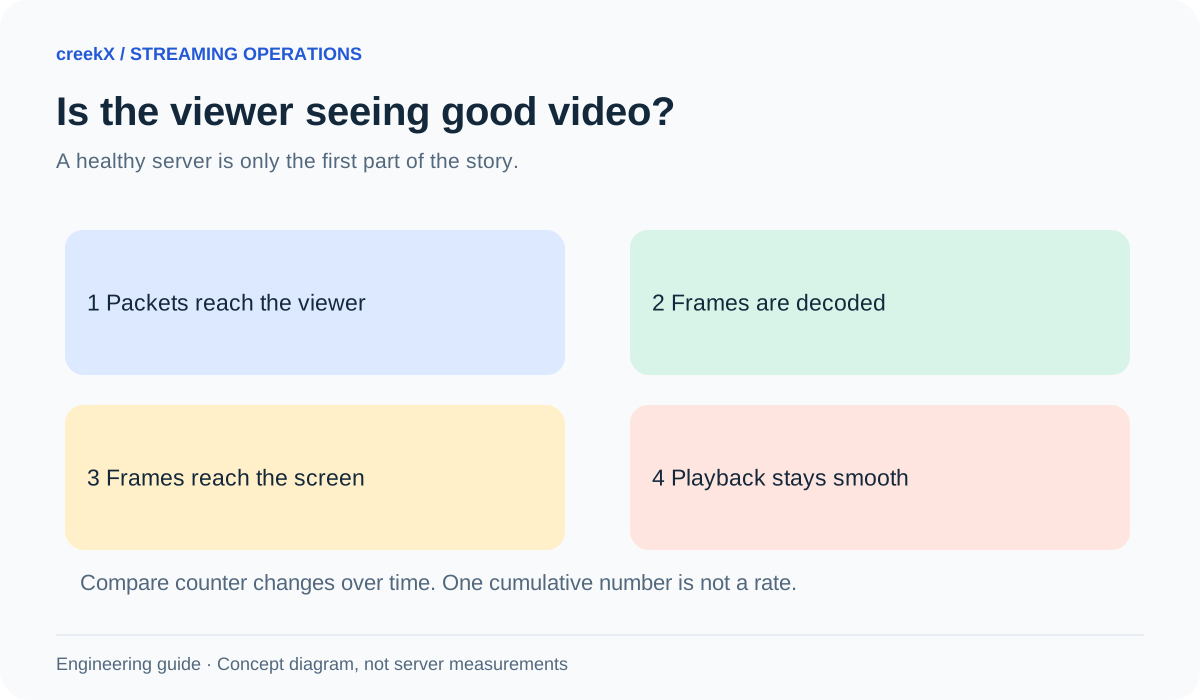
Your server says live. Is the viewer seeing good video?
A green service check answers one question: is that service responding? It cannot tell you whether a viewer has a moving picture, clear sound or a phone that is too busy to decode the stream. Good monitoring follows the video all the way to the viewer.
Use this guide during a test session. It explains useful WebRTC signals, not a new creekX dashboard feature. Some browser statistics are optional or unavailable on a particular browser.
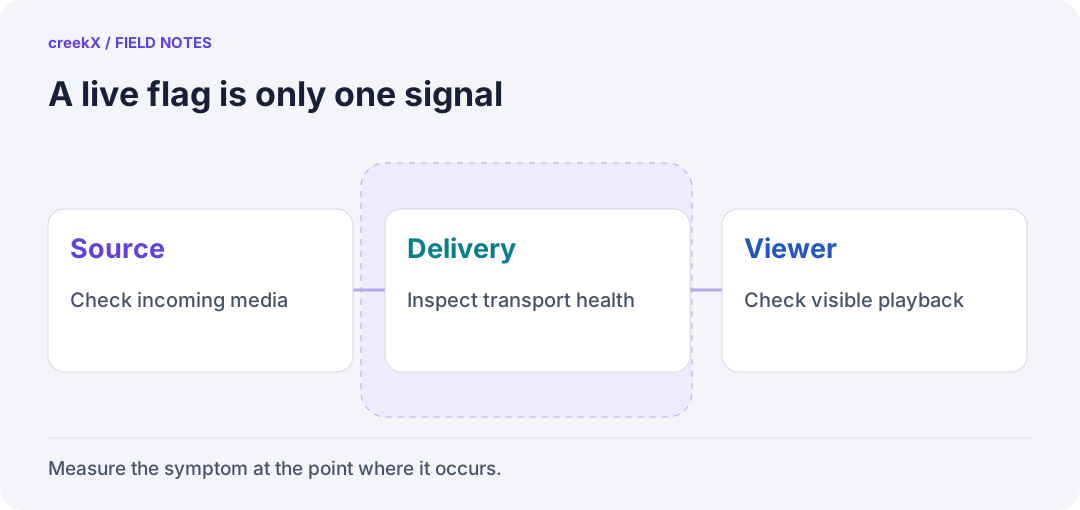
- SourceCheck incoming media
- DeliveryInspect transport health
- ViewerCheck visible playback
Start with a visible symptom
Write down what the viewer reports: slow start, repeated freezes, blocky video, missing sound or a growing delay. Include the time, browser version, playback method and connection type. “Streaming is broken” gives the operator much less to work with than “the phone freezes while the laptop on a wired connection keeps playing.”
Keep a second viewer as a reference. If both lose the same source at the same moment, investigate upstream. If one freezes while the other continues, check what differs between their paths. That comparison is a clue, not proof of a single cause.
Read these signals together
| Signal | Useful question | Limit |
|---|---|---|
| Bytes received | Is media still arriving? | Bytes do not prove successful decoding. |
| Frames decoded | Is the decoder making new pictures? | Decoded frames can still arrive too late. |
| Frames dropped or freezes | Is the viewer losing smooth playback? | Support and definitions vary; a missing field is not zero. |
| Packets lost and jitter | Is delivery becoming uneven? | One lifetime total cannot describe the last few seconds. |
The W3C WebRTC statistics specification defines the fields and their units. In particular, jitter is reported in seconds. Never display a raw value as milliseconds without conversion.
Take two samples, not one
Many values are counters from the life of a connection. Compare the same statistic at two times. For example, receive bitrate is eight times the increase in received bytes, divided by elapsed seconds. Check that the statistic ID and connection still match; a reconnect can create a new series.
// Calculation for two valid samples from the same inbound stream.
const elapsedSeconds = (newer.timestamp - older.timestamp) / 1000;
const byteIncrease = newer.bytesReceived - older.bytesReceived;
const receiveBitsPerSecond = 8 * byteIncrease / elapsedSeconds;
Reject non-positive elapsed time, counter resets and missing values before calculating. This is a diagnostic formula, not a complete monitoring client. Do not turn unavailable values into healthy-looking zeros. Keep the raw sampling interval next to each derived rate.
Use a simple diagnosis order
- Source: check whether the encoder is still sending and whether its own frame-drop or overload indicators changed.
- Server: check stream status, outgoing bandwidth, CPU, memory and disk. Match the time window to the complaint.
- Delivery: compare the affected viewer with another network. Look for rising loss, jitter, connection changes or a relay path.
- Device: if bytes arrive but decoding slows, test a lower-resolution source or another device before adding server capacity.
A single brief spike should not trigger the same response as a sustained viewer outage. Pick alert thresholds from your own rehearsal and the event's needs. There is no universal packet-loss number that means every live stream will fail.
Keep alerts useful and private
Alert on a problem someone can act on, such as repeated failed starts or a sustained loss of usable playback. Link the alert to the relevant stream and a short recovery action. The Prometheus alerting guidance recommends focusing on symptoms that affect users and allowing for short blips.
Collect only what is needed. Do not send stream keys, private watch links or full connection dumps to a public analytics service. Browser diagnostics can contain network details; review them before sharing with support.
Apply it to your creekX test
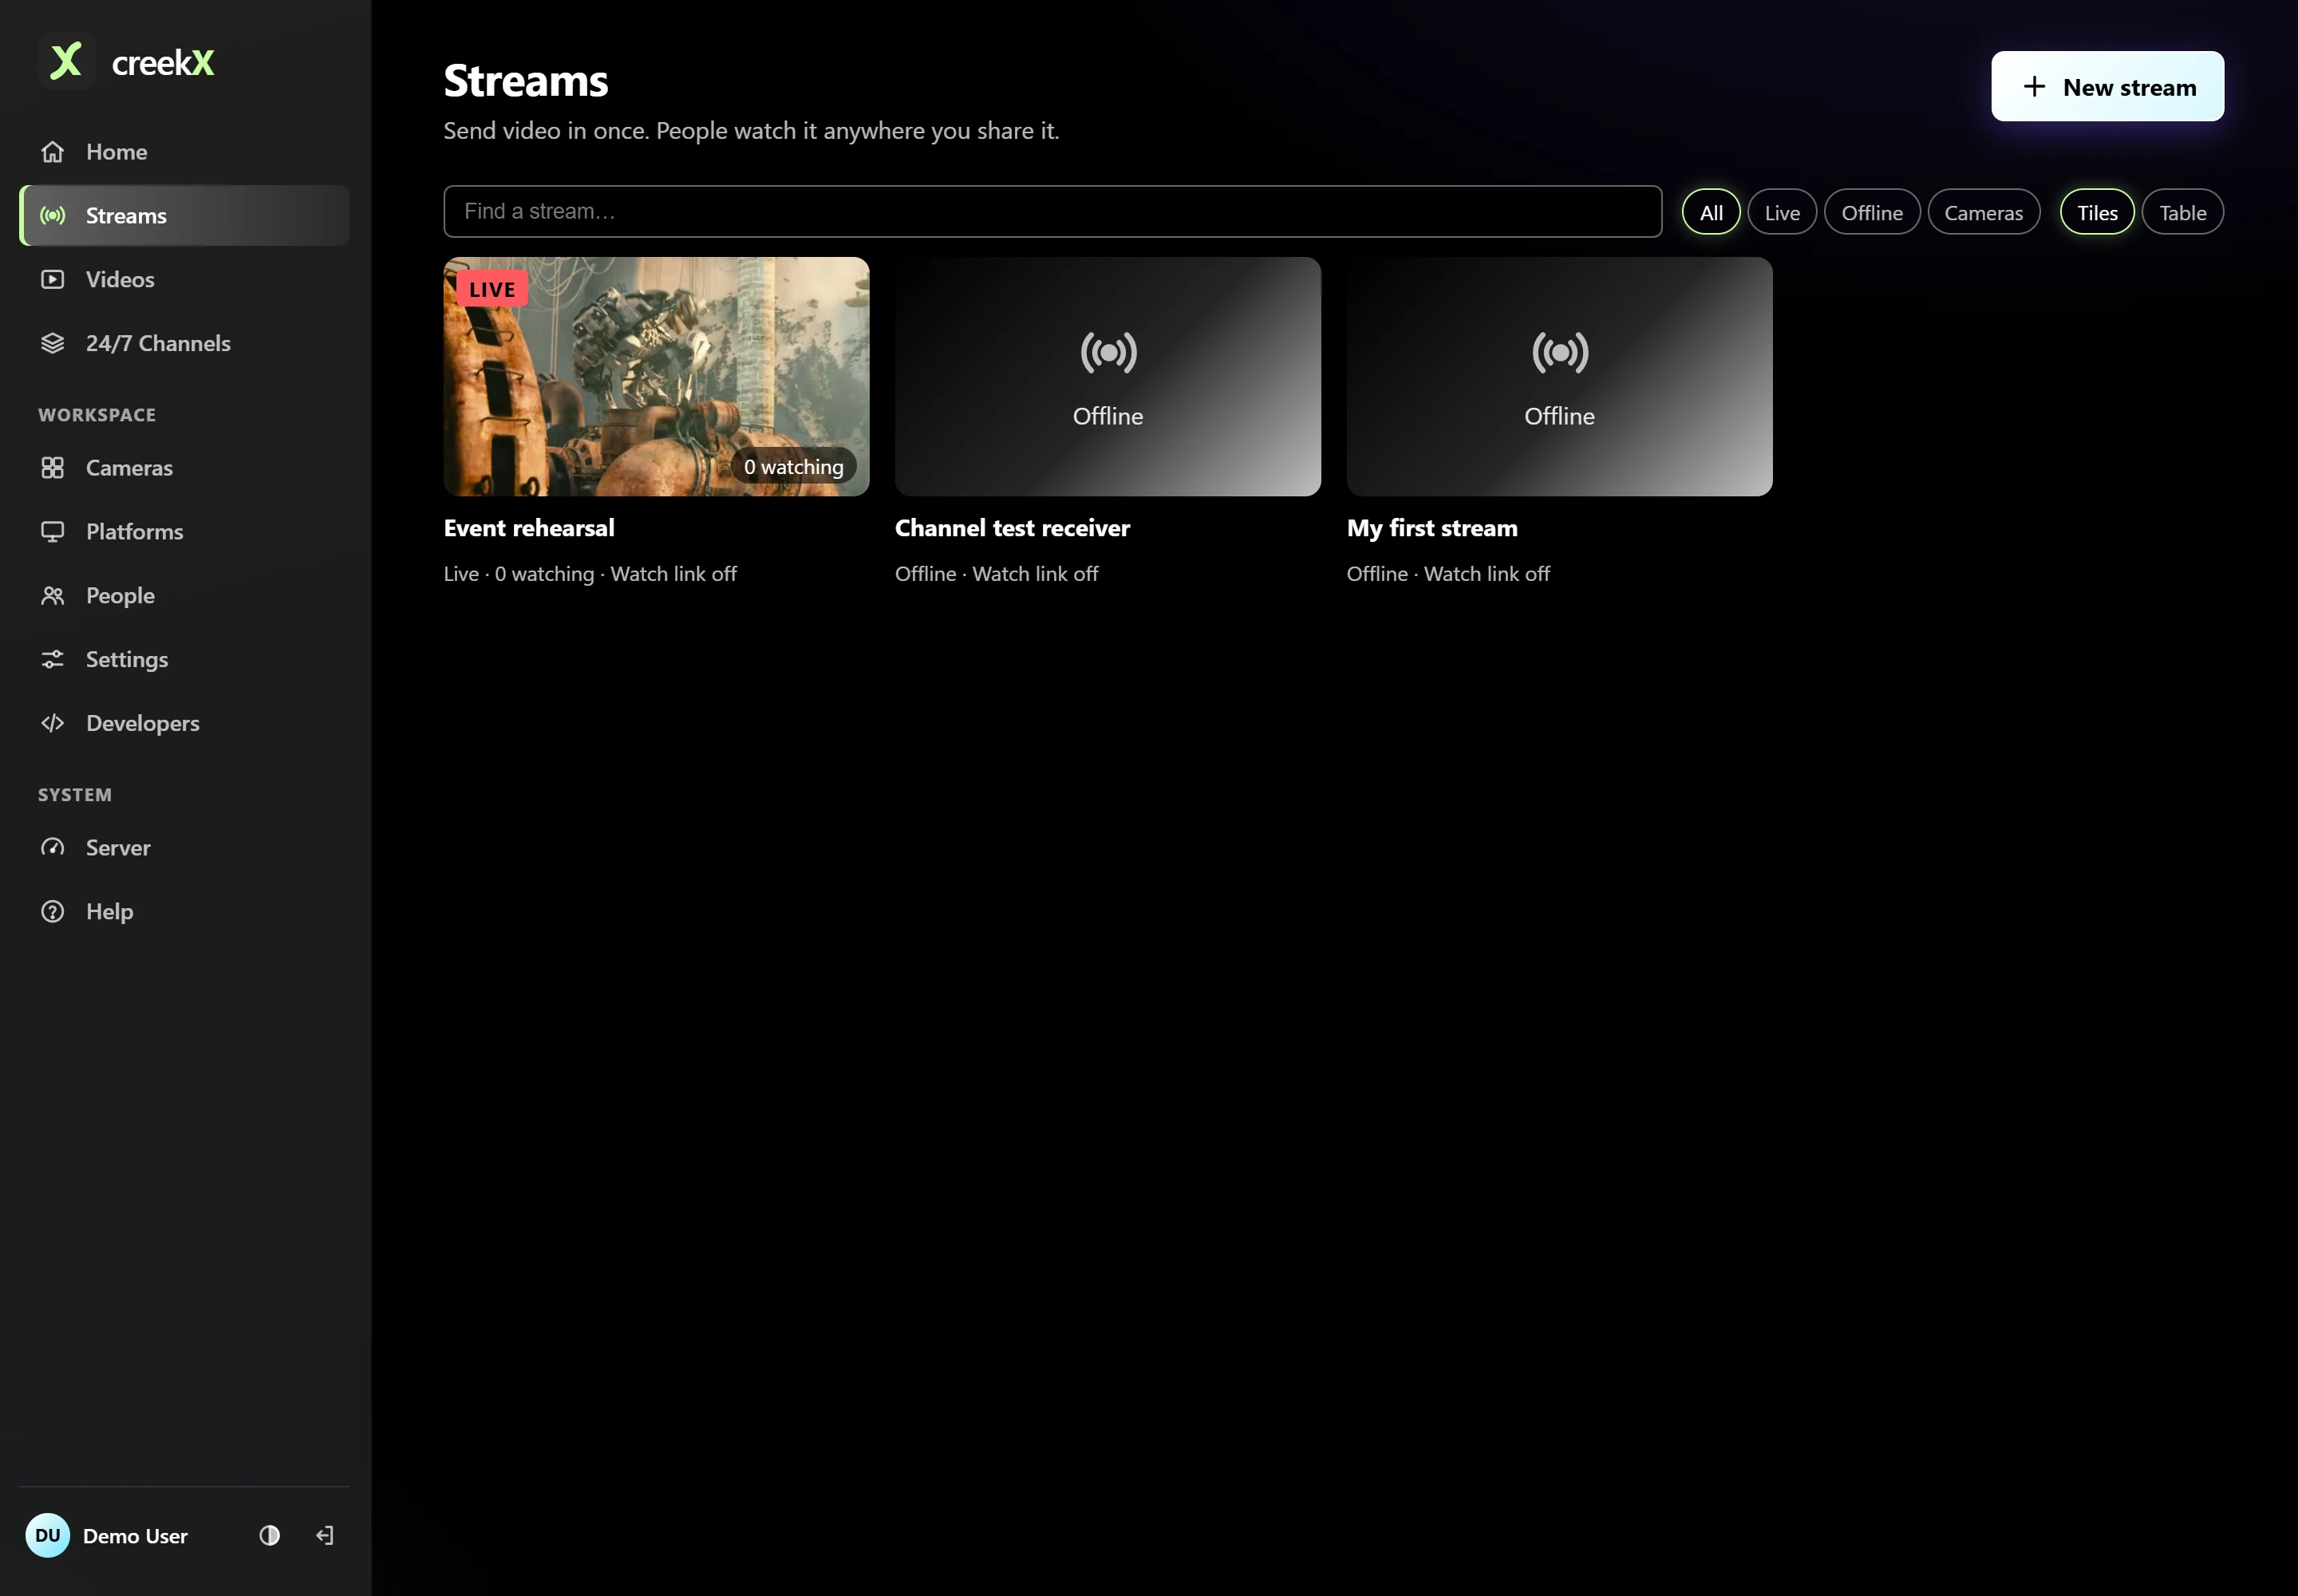
Open the stream status and compare it with a real watch session. The dashboard guide explains the source, monitor and server views. For automated server checks, start with the documented REST API; browser quality measurement remains a separate layer.
Use the startup-time test if joining is the problem. For a whole-system view, return to the streaming server guide.
Implementation check
Use counter deltas from the same session
You need: A player you own with access to its RTCPeerConnection and a moving source.
- Take two inbound-RTP samples for the same report ID and compute deltas over elapsed time.
- Treat a changed report ID, reconnect or counter reset as a new interval. Mark unavailable fields as unknown.
- Compare bytes, decoded frames, loss and visible freezes; keep raw private addresses and tokens out of telemetry.
Pass when: A rate is tied to a valid interval and the viewer symptom, not a cumulative counter presented as a live measurement.
If it fails: Missing decoded frames with arriving bytes points to a different investigation from a disconnected transport.
Frequently asked questions
Does zero packet loss prove good WebRTC playback?
No. Decoding limits, an overloaded device, source problems and freezes can still hurt playback. Read several signals and check the actual picture and audio.
Does creekX expose every browser statistic in its dashboard?
This guide describes browser-level diagnostic signals, not a promise that every WebRTC statistic is available in the creekX dashboard. Instrument a player you control or use the browser’s diagnostic tools.